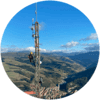
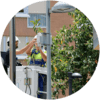
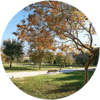
Castellón Smart City – Pilot is installed at the neighbourhood of Pau Gumbau of Castellón, Spain. Pilot takes place over an area that covers 222.000 square meters where near 8.000 citizens live and work on their daily basis together with gardens, parks, schools and private & public buildings among others infrastructures.
Client: IoTsens decided to start this project in order to show its Platform for Smart City working in real time, giving municipality and private companies the opportunity to try the IoTsens software, hardware and communications working together in our platform before paying for it, thus providing added value to our service.
Objective: To provide a comprehensive view of Pau Gumbau neighborhood and all its services including more than 25 types of sensors to provide information for a large variety of vertical solutions integrated in the same platform.
[/et_pb_text][et_pb_text admin_label=”Platform” background_layout=”light” text_orientation=”left” use_border_color=”off” border_color=”#ffffff” border_style=”solid”]
Platform: These are, among others, the main IoT Solutions integrated in the IoTsens Smart City pilot:
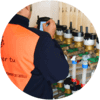
- Smart Water Metering: reading from seven water meters brands (Itron, Elster, Sensus, Kamstrup, Diehl, Conthidra and Contazara) and collecting data from all householders in the city in order to track and control accurately water management under the same platform.
- Smart Waste Water: allows the user to keep real-time tracking of the wastewater pipelines (water height, flow, % fill, spill alarms or temperature) in order to detect problems and proceed with solutions.
- Smart Urban Waste: keep real time track of the percentage (%) fill status of the bins achieving more efficient the waste-truck routes.
- Smart Park Irrigation: controls the activation and deactivation of parks irrigation depending on the humidity that sensors are receiving from the soil.
- Air Quality: collects key pollution levels in cities, allowing real time decision making to reduce it. Easy and reliable solution to control air in long and short term deployments.
- Water Quality: allows the gathering of water quality data in real-time across industrial or utility networks from measuring instruments in the watershed or treatment plants.
- Meteorological Station: collection of real time data of variables like rainfall, humidity, wind intensity and atmospheric pressure helping the determination of certain alarm levels.
- Smart Parking: controls real-time availability and usage of the parking space allowing its efficient management.
Each of integrated solutions on platform can be analyzed individually, providing historical and real time data in order to obtain information of every activity area.
In addition, the platform offers the option to configure a dashboard in order to provide the foundations for a fast visualization of the state and historical analysis of the system. This way, users can gather the most relevant data for their goals and react according to the system state. They can use multiple dashboards, each of them showing different information according their preferred categorizations (environment, traffic, alarms, energy, etc.).
[/et_pb_text][/et_pb_column][/et_pb_row][et_pb_row admin_label=”Fila”][et_pb_column type=”1_2″][et_pb_image admin_label=”Imagen” src=”https://www.iotsens.com/wp-content/uploads/2016/05/City_BarGraph-2.png” show_in_lightbox=”off” url_new_window=”off” use_overlay=”off” animation=”off” sticky=”off” align=”left” force_fullwidth=”off” always_center_on_mobile=”on” use_border_color=”off” border_color=”#ffffff” border_style=”solid” saved_tabs=”all”] [/et_pb_image][/et_pb_column][et_pb_column type=”1_2″][et_pb_image admin_label=”Imagen” src=”https://www.iotsens.com/wp-content/uploads/2016/05/City_Map-1.png” show_in_lightbox=”off” url_new_window=”off” use_overlay=”off” animation=”off” sticky=”off” align=”left” force_fullwidth=”off” always_center_on_mobile=”on” use_border_color=”off” border_color=”#ffffff” border_style=”solid” saved_tabs=”all”] [/et_pb_image][/et_pb_column][/et_pb_row][et_pb_row admin_label=”Fila”][et_pb_column type=”4_4″][et_pb_text admin_label=”Platform (ending)” background_layout=”light” text_orientation=”left” use_border_color=”off” border_color=”#ffffff” border_style=”solid”]Each of integrated solutions on platform can be analyzed individually, providing historical and real time data in order to obtain information of every activity area.
In addition, the platform offers the option to configure a dashboard in order to provide the foundations for a fast visualization of the state and historical analysis of the system. This way, users can gather the most relevant data for their goals and react according to the system state. They can use multiple dashboards, each of them showing different information according their preferred categorizations (environment, traffic, alarms, energy, etc.).
[/et_pb_text][et_pb_text admin_label=”Result” background_layout=”light” text_orientation=”left” use_border_color=”off” border_color=”#ffffff” border_style=”solid”]Result: The development of IoTsens platform in this neighborhood is a new system of daily management of resources allowing optimization and efficiency, thus facilitating the work of administrations and providing more information to citizens, with the ultimate aim of improving their life quality.
[/et_pb_text][/et_pb_column][/et_pb_row][et_pb_row admin_label=”Fila”][et_pb_column type=”1_2″][et_pb_text admin_label=”why iotsens” background_layout=”light” text_orientation=”left” use_border_color=”off” border_color=”#ffffff” border_style=”solid”]Why IoTsens: Along with these solutions, IoTsens Smart City platform offers the integration of different municipal services of the Castellón City Council, such as the municipal bicycle service called “BiciCas”, the public transport service and the taxi service, which facilitates the collection of information. The IoTsens solution allows you to merge all connected assets in real time, providing relevant and valuable information for decision makers.
[/et_pb_text][/et_pb_column][et_pb_column type=”1_2″][et_pb_image admin_label=”Screenshot Dashborad” src=”https://www.iotsens.com/wp-content/uploads/2016/05/City_Dashboard-1.png” show_in_lightbox=”off” url_new_window=”off” use_overlay=”off” animation=”left” sticky=”off” align=”left” force_fullwidth=”off” always_center_on_mobile=”on” use_border_color=”off” border_color=”#ffffff” border_style=”solid”] [/et_pb_image][/et_pb_column][/et_pb_row][/et_pb_section]

